A user of one of my web applications sent the following question :
Hi my name is T. and I am 15, when I am older I want to be a part of the gaming industry and I am just wondering can you guys help with that, can you give me any tips or any experience?
Would posting to your website help me out in this? I would love to hear your reply, it would really help me out.
Here was my reply:...
Read more
This study is a comparative study of two particular types of visualization techniques in detail.
We chose to study the map-based visualization and the bubble charts because they had been the most fascinating visualizations throughout this study. We are going to compare those two types on many factors.
Defining the visualizations
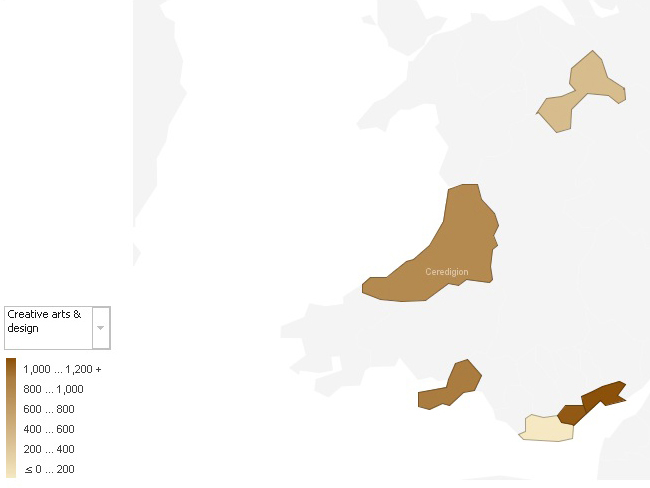
A thematic map is a type of map or chart especially designed to show a particular theme connected with a specific geographic area. These maps can portray physical, social, political, cultural, economic, sociological, agricultural, or any other aspects of a city, state, region, nation or continent....
Read more
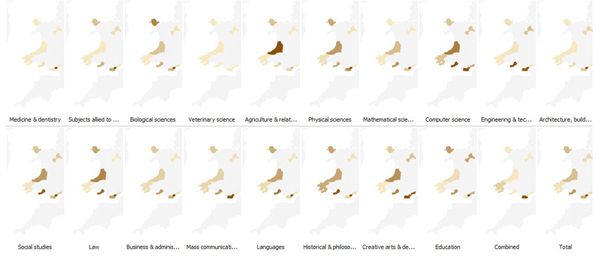
This study is about the production and the description of some advanced visualization charts related to the higher education in South West Wales. Some real data had been made available to complete this task and the objective is to get some meaningful and interesting insight about the data.
The tool used is IBM Many Eyes. It’s a web service that lets user upload data sets and can turn them into various visualizations. There were a lot of choices but only advanced visualization types (especially maps) had been highly recommended rather than basic charts. Further, graphs that show rises and falls over time had to be avoided as the provided data was not time oriented. So the five visualization types demonstrated here are block histograms, bubble charts, maps, matrix charts and tree maps....
Read more
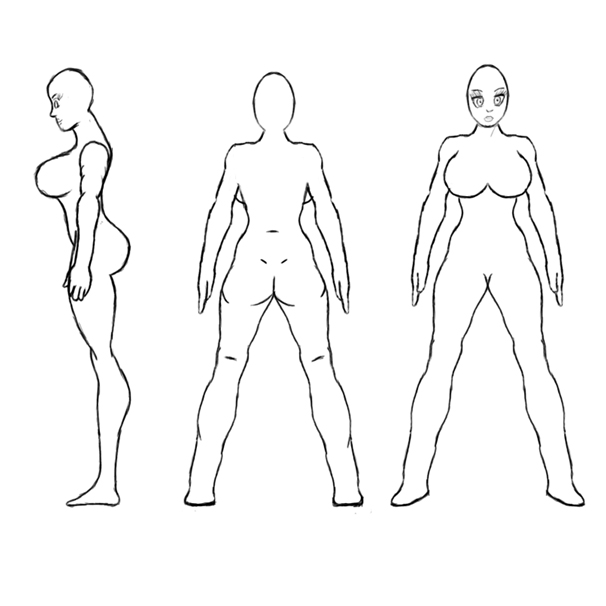
How I draw the 2D characters
Due to the nature of the drawing art, which is not really computer science related, I thought it was best to describe this process in another part right after the progress description. This work had been a full part of the project and even though it does not directly concern programming (before we get into animation), it is also a computer work involving a pen tablet and some image processing software (Adobe Photoshop). The following screenshots describe the steps in the drawing of one character (out of four)...
Read more
Quite amazing... Beauty of Math :
1 x 8 + 1 = 9
12 x 8 + 2 = 98
123 x 8 + 3 = 987...
Read more