![[Interview] In The Bubble of Yehni Djidji: "I offer educational entertainment and life-changing experiences to children"](/Blog/image.axd?picture=2018%2f3%2fYehni_Djidji.jpg)
1. Quick (but effective) introduction of the personage and her achievements?
I am Rosine Kakou Ano. Graduated in Communication, Marketing and Management. I have been operating under the pseudonym "Yehni Djidji" since 2008, which was the year when I launched my blog. I am the founder of a literary agency called Livresque that helps those who wish to publish a book throughout the process, organises events about literature and offers educational entertainment to children....
Read more
![[Interview] In The Bubble Of Israel Yoroba: "I am president, elite serial entrepreneur, veteran blog trotter, catalyst for change in our generation"](/Blog/image.axd?picture=2018%2f3%2fIsrael_Yoroba.jpg)
1. Quick (but effective) introduction of the personage and his achievements?
My name is Israel GUEBO. Better known as Israel Yoroba. I am a Media Expert and Coach, and specialist in social networks. I am also President of the Génération Innovante association. Furthermore, I am a member of the Bureau of the Network of Online Press Professionals of Ivory Coast, I am in charge of training and self-regulation.
I am a journalist by training and profession, graduated from the Superior School of Journalism of Lille, France.
From my experience, I keep the most important ones. I trained the press service of the office of the president of the National Assembly, the communication department of the Presidency of the Republic and worked as coordinator of the digital communication for the Ministry of Youth.
From Print to Radio and Web, I have just over 10 years of experience with International Media. For 6 years (2008-2013), I had been a correspondent in Abidjan for the Web editorial of the French channel TV5. As such, I covered the 2008 US elections, the 2010 presidential elections and the subsequent military-political crisis in The Ivory Coast.
Between 2014 and 2017, I was chief editor of the "Studio Mozaik" Radio School, and later Head of the Hemisphère Media Production Office. That is the company that provides correspondence for TF1 in Africa and for France 24 in some countries of West and Central Africa.
For a decade, I have traveled around Francophone Africa to train state institutions. In Togo, Benin, Burundi, Gabon, Guinea... I train Senators and Members of Parliaments for the use of new media in institutional communication. This is taking place as part of the Noria program, initiated by the Francophone Parliamentary Assembly (APF), an institution for which I am a consultant.
I was also a web editor for the France 24 blog. In 2011, I did a brief stint at Radio France Internationale (RFI) on the program "L'atelier des médias". What I was most reknown for was the "Avenues", these local information sites with a presence in several African countries. Besides the Avenues, I launched, in 2013, the first Web Radio of information in Ivory Coast: Class FM (www.classe.fm).
All this earned me several distinctions:...
Read more

If you have ever checked the weather online, used the navigation function of your smartphone to find an on-duty pharmacy, or calculated the road expenses of your municipality, then you have already used "Open" Public Data. But maybe you didn't know it... For a long time, it was difficult (or even impossible) to access this information from the public authorities.
This concept was born from the belief that the huge amount of information systematically collected by public administrations should be accessible to all citizens. In the late 2000s, states and their various services began to grant access to these resources to a greater number of users. The first government open data policies were introduced in 2009. Currently, more than 250 national and local governments, nearly 50 developed/developing countries, and institutions such as the World Bank and the United Nations have launched initiatives to release the data, and these are growing every year.
Data is considered "open" if everyone can use, reuse and redistribute it freely, free of charge, for any purpose and without restrictions. Many data sets are published on government websites, but most of them are only meant to be viewed in isolation, and are not reusable for other purposes. Open data must be reusable, that is, downloadable in an open, software-readable format, and users must be legally permitted to reuse it....
Read more

The Selfie. Everyone knows everything about it... Or do they? How was it born? Where does it come from? Here I decided to dedicate an article to the Selfie story. I, a good disciple of the Web Lord, took my laptop pilgrim to write this article and preach the Good News of Technology to you, my dear readers......
Read more
This study is a comparative study of two particular types of visualization techniques in detail.
We chose to study the map-based visualization and the bubble charts because they had been the most fascinating visualizations throughout this study. We are going to compare those two types on many factors.
Defining the visualizations
A thematic map is a type of map or chart especially designed to show a particular theme connected with a specific geographic area. These maps can portray physical, social, political, cultural, economic, sociological, agricultural, or any other aspects of a city, state, region, nation or continent....
Read more
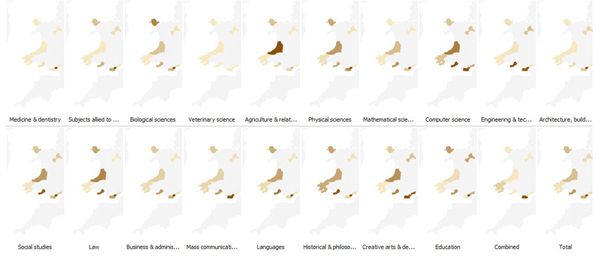
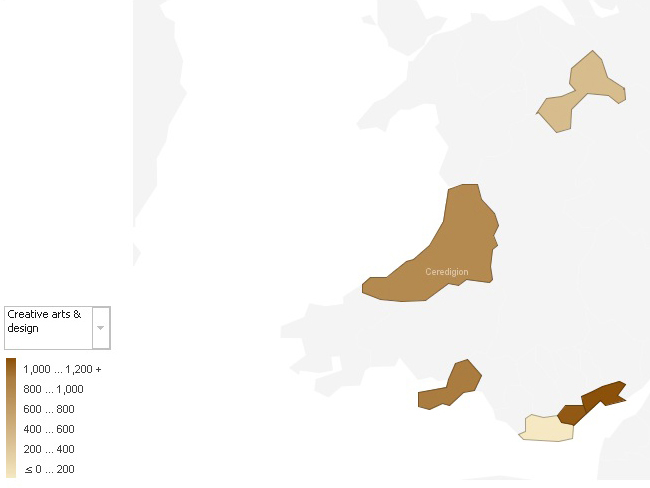
This study is about the production and the description of some advanced visualization charts related to the higher education in South West Wales. Some real data had been made available to complete this task and the objective is to get some meaningful and interesting insight about the data.
The tool used is IBM Many Eyes. It’s a web service that lets user upload data sets and can turn them into various visualizations. There were a lot of choices but only advanced visualization types (especially maps) had been highly recommended rather than basic charts. Further, graphs that show rises and falls over time had to be avoided as the provided data was not time oriented. So the five visualization types demonstrated here are block histograms, bubble charts, maps, matrix charts and tree maps....
Read more