
Debugging is the process of finding and resolving defects or problems within the program that prevent correct operation of computer software or a system. Debugging tactics can involve interactive debugging, control flow analysis, unit testing, integration testing, log file analysis, monitoring at the application or system level, memory dumps, and profiling.
Some bugs may be easy to track. I don't want to talk about those. Let's discuss the really mysterious ones.
Like the saying goes, Theory is when one knows everything but nothing works; Practice is when everything works but nobody knows why. Sometimes Theory and Practice go hand in hand: nothing works and nobody knows why. In such cases, it's worth remembering about some effective techniques that often allow us to reach the root of the problem and to display its finer details. Over time, here are the 3 techniques that have been most useful when debugging with Visual Studio:
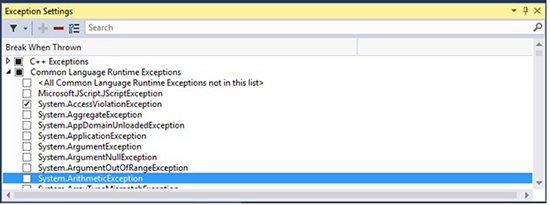
1. Managing relevant exceptions with the Exception Settings Window
An exception is an indication of an error state that occurs while a program is being executed. You can and should provide handlers that respond to the most important exceptions, but it’s important to know how to set up the debugger to break for the exceptions you want to see. You can use the Exception Settings window to specify which exceptions (or sets of exceptions) will cause the debugger to break, and at which point you want it to break. You can add or delete exceptions, or specify exceptions to break on. Open this window when a solution is open by clicking Debug / Windows / Exception Settings.
You can find specific exceptions by using the Search window in the Exception Settings toolbar, or use search to filter for specific namespaces (for example System.IO). The debugger can break execution at the point where an exception is thrown, giving you a chance to examine the exception before a handler is invoked.
In the Exception Settings window, expand the node for a category of exceptions (for example, Common Language Runtime Exceptions, meaning .NET exceptions), and select the check box for a specific exception within that category (for example System.AccessViolationException). You can also select an entire category of exceptions.
2. Not "Just My Code"
By default, the Visual Studio debugger only breaks on exceptions generated from your own (user) code, hence skipping other system, framework, and other non-user calls. The feature that enables or disables this behavior is called "Just My Code". Depending on what you are debugging, you may want to disable it, because the source or description of the issue might well be outside of "your" code.
To disable (or enable) Just My Code, choose the Tools > Options menu in Visual Studio. In the Debugging > General node, clear (or choose) Enable Just My Code.

3. Recommended tools for Tracing and Error Logging
Sometimes you need to record and analyse the full details of the errors, the events and the inner exceptions: that tracing involves a specialized use of logging to record information about a program's execution, typically for debugging purposes. Here are my favorite logging and tracing tools:
- Systems.Diagnostics
- Microsoft Entreprise Library
- NLog
- Elmah
- Log4net
Voilà.