
If you have ever checked the weather online, used the navigation function of your smartphone to find an on-duty pharmacy, or calculated the road expenses of your municipality, then you have already used "Open" Public Data. But maybe you didn't know it... For a long time, it was difficult (or even impossible) to access this information from the public authorities.
This concept was born from the belief that the huge amount of information systematically collected by public administrations should be accessible to all citizens. In the late 2000s, states and their various services began to grant access to these resources to a greater number of users. The first government open data policies were introduced in 2009. Currently, more than 250 national and local governments, nearly 50 developed/developing countries, and institutions such as the World Bank and the United Nations have launched initiatives to release the data, and these are growing every year.
Data is considered "open" if everyone can use, reuse and redistribute it freely, free of charge, for any purpose and without restrictions. Many data sets are published on government websites, but most of them are only meant to be viewed in isolation, and are not reusable for other purposes. Open data must be reusable, that is, downloadable in an open, software-readable format, and users must be legally permitted to reuse it....
Read more
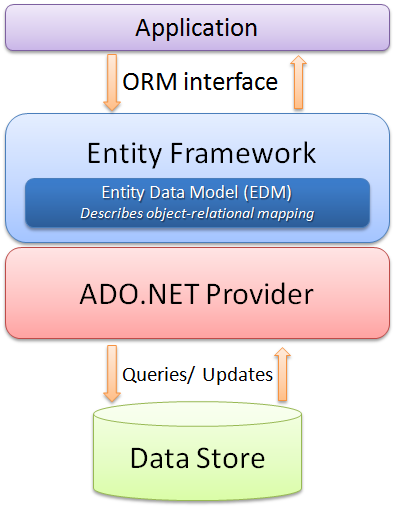
The Entity Framework is an ORM system, a set of technologies that support the development of data-oriented software applications. It's part of the .NET Framework. I have been playing with it for a couple of years and here are my top tips :...
Read more
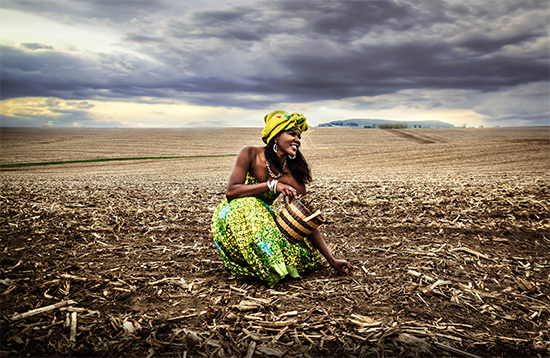
In addition to being the cradle of humanity, Africa is becoming the cradle of entrepreneurs. As a matter of fact, when it comes to the world rankings of the countries with the largest number of entrepreneurs, Africa plays the leading role!
While entrepreneurs in the United Kingdom and the United States are associated with start-ups, in some other countries, especially in Africa, entrepreneurship for freelancers is more of a necessity than a dream. Indeed, when there are not enough jobs available like in many African countries, you have to create their own opportunities....
Read more

While facing the problem of youth employability, African countries today strive to improve the quality in their education systems by using ICTs. One of the lessons learned from the case studies in relevant countries shows that the integration of ICT in Education can be beneficial, not only in terms of Education, but also in terms of Entrepreneurship and Employability....
Read more
"Curator" is a term used in museums. It refers to the person who chooses artworks for an exhibition, the curator is called upon to make a choice, a comment and an introduction of some existing works. He is the link between the artist (or the cultural heritage) and the public. He is an expert. The curator on the Internet, after defining the topics of his technological watch, may choose to work from a curation platform allowing him to automatically or manually harvest, filter, editorialise and share some online content. As a marketing tool, how can "Content Marketing" be used as teaching tool in higher education?...
Read more
There is a quote that says "Everything that is rare is expensive". In sub-Saharan Africa, in that "Everything", it seems that we must include Everything but the teaching profession.
Indeed, the shortage of teachers that affects the whole world in general is particularly more pronounced in sub-Saharan Africa. If we stick to the quote, this situation should have had the effect of raising the salary of teachers to attract as many people as possible in the profession. But no! On the contrary, it appears to be driving teachers' salaries down. In The Ivory Coast for example, in the schools, you can find benevolent teachers and volunteer teachers alongside state civil service teachers....
Read more
This study is a comparative study of two particular types of visualization techniques in detail.
We chose to study the map-based visualization and the bubble charts because they had been the most fascinating visualizations throughout this study. We are going to compare those two types on many factors.
Defining the visualizations
A thematic map is a type of map or chart especially designed to show a particular theme connected with a specific geographic area. These maps can portray physical, social, political, cultural, economic, sociological, agricultural, or any other aspects of a city, state, region, nation or continent....
Read more
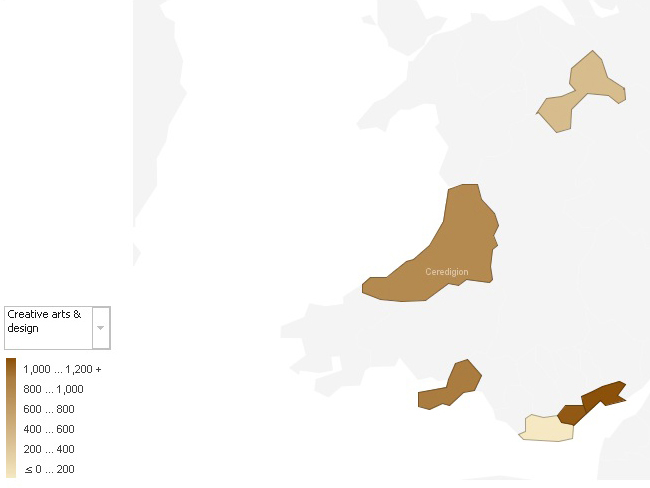
This study is about the production and the description of some advanced visualization charts related to the higher education in South West Wales. Some real data had been made available to complete this task and the objective is to get some meaningful and interesting insight about the data.
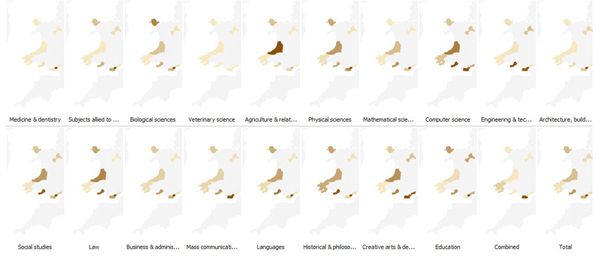
The tool used is IBM Many Eyes. It’s a web service that lets user upload data sets and can turn them into various visualizations. There were a lot of choices but only advanced visualization types (especially maps) had been highly recommended rather than basic charts. Further, graphs that show rises and falls over time had to be avoided as the provided data was not time oriented. So the five visualization types demonstrated here are block histograms, bubble charts, maps, matrix charts and tree maps....
Read more